As we aim to follow the best UX and UI practices while creating or redesigning our website, it’s tempting to assume that the way it currently appears and operates, or that our new planned interface, is the most favorable and convenient for our visitors.
In fact, due to our inherent psychological preference for maintaining the status quo, it’s pretty much unavoidable that we feel this way.
But obviously there’s a huge gap between our inherent bias towards our existing screens and the perceptions and responses of our audience. This leads to the question: what opportunities exist for us to validate our UX and UI assumptions, and how can we reconfirm them over time?

Oh to be a fly on the wall, you can with Session recordings heatmaps
In an ideal scenario, we could peek over every visitor’s shoulder as they browse our website and observe them as they navigated our site and attempted to complete their goals, and once they were done we could ask them what their impression was, and what feedback they might have for implementing improvements.
Sadly that’s impossible, but there are tools available that get us pretty close to that goal by allowing us to observe and record our visitors’ behavior as they browse our website. These tools that aggregate website usage statistics in various formats are commonly referred to as analytics tools.
Google Analytics will show you aggregate statistics
The most commonly used website statistics platform is Google’s trusted Analytics suite, which gives a very solid and in-depth analysis of how visitors find and interact with our website in aggregate, and is backed by an entire academy’s worth or training materials. But these aggregates aren’t as helpful as you’d think when it comes to understanding how individuals are actually interacting with your site. It’s a case of being unable to see the trees due to the forest.
Session recordings for-the-win
To help with getting insights into the actions of individual users we need something else – Enter session recording tools and heatmaps. Both these tools are highly effective at giving us a clear view of how users are interacting with our screens, where they’re facing issues, and what we can do to ensure they have a better experience. The bottom line of gaining these insights and acting upon them is a clear improvement to our marketing efforts through increased engagement, more conversions and reduced churn.
How does session recording work?
Session recordings are a process whereby a script is installed on our website which then allows us to record the actual browsing sessions of visitors on our site. Using this technology we can see, for each visitor on our site:
- Where and how they moved their mouse.
- How they scrolled the content.
- What they highlighted.
- Where they clicked.
Every action the user took on our site is recorded and can be played back. Viewing these sessions tends to reveal patterns of usage that are repeated by visitors over and over. Ideally these are patterns that match our expectations, but if they’re not, then at least we’ve identified an issue that needs our attention.
What are heatmaps?
Heatmaps are normally created from aggregations of session recordings, and provide a very visual and clear indication of where on the page our visitors are directing most of their attention and spending most of their time.
As indicated by their names heatmaps use a color-coding of intensities to highlight the buttons/areas visitors are most engaged with and, depending on the particulars of the tool, how far down the page they usually scroll.
What heatmaps lack in the granularity and detail of that session recordings provide, they make up by giving a more holistic overview of how people are responding to our screens.
Let’s look at some of the tools available for gaining these types of data:
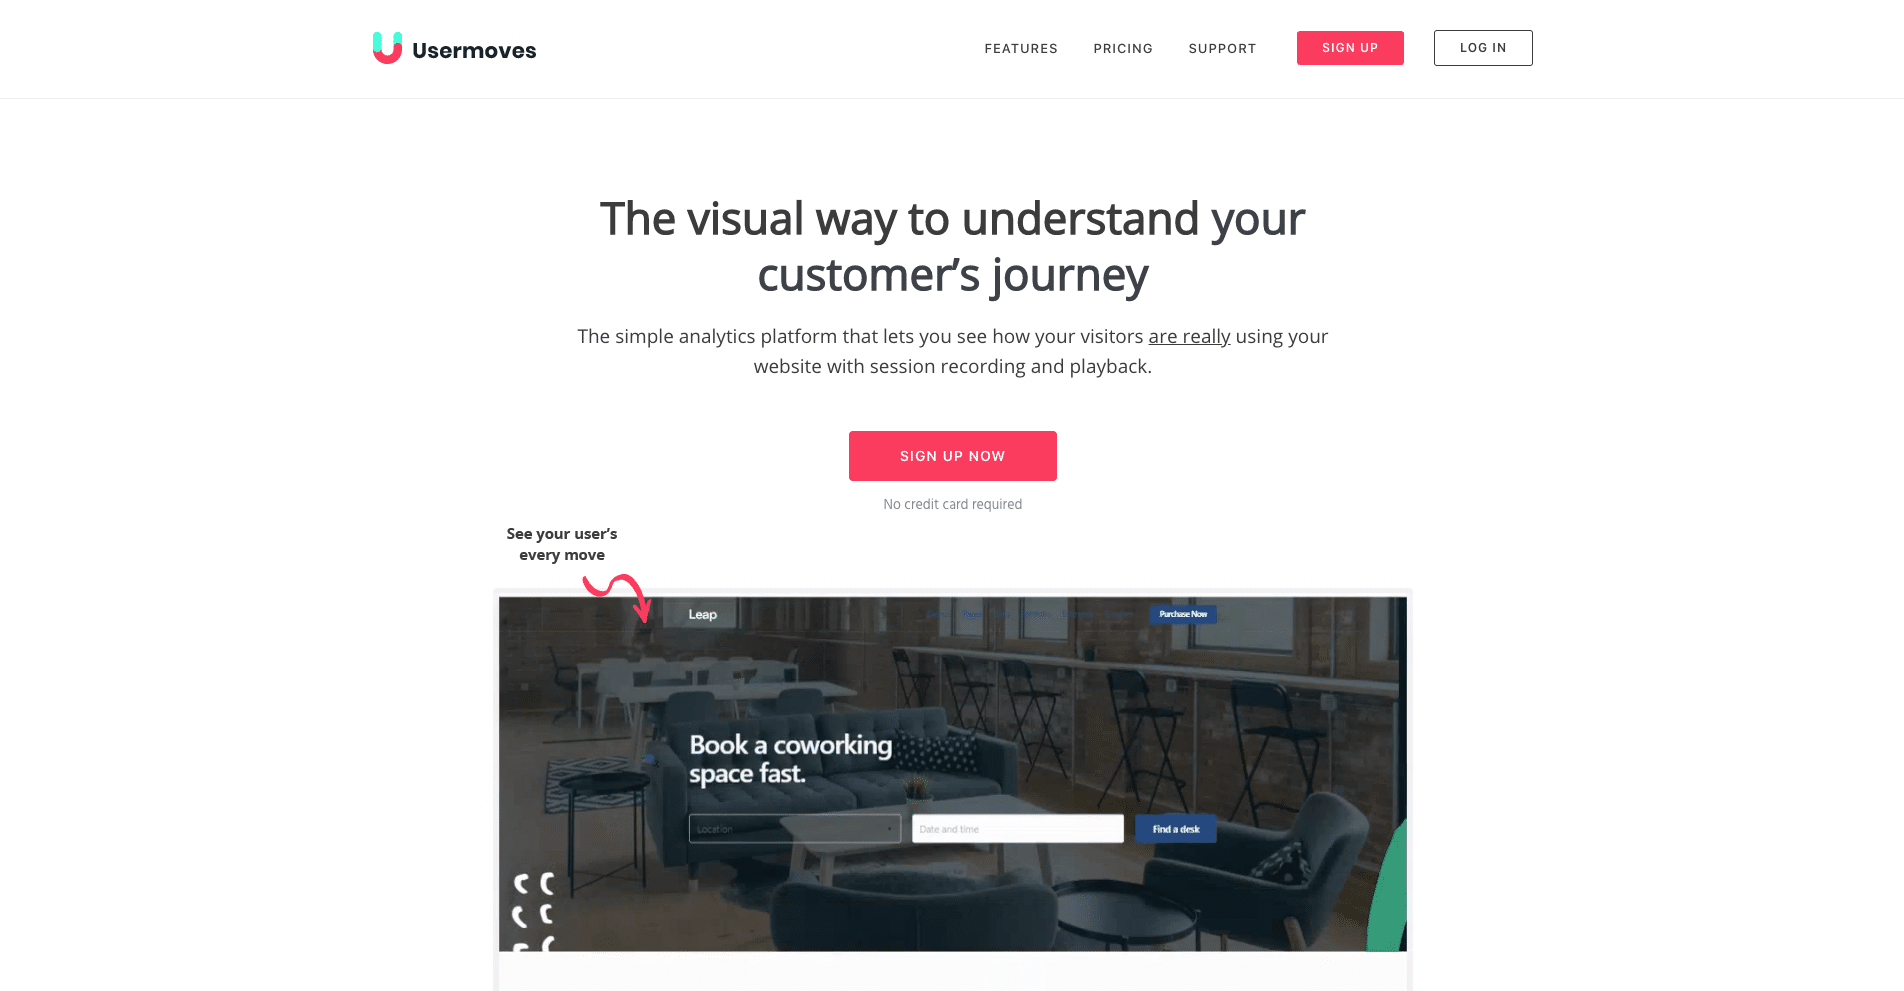
Usermoves
Usermoves presents itself as an easy-to-use analytics tool for session recording and playback. It’s quite helpful insofar as a glimpse as to how website visitors are actually using the website.
The type of insights you could expect to gain from seeing your visitor’s mouse movements and clicks would be
- Figuring out where and why visitors are bouncing
- What users find attractive on a page.
- What copy is compelling, and what isn’t
- etc.
Usermoves also have heatmaps to show which spots on the site are the clicked on, but to be honest they’re quite basic.
Usermove’s data and insights are mostly qualitative, although some quantitative analytics are provided as well – We can look at things like the number of page-views, the country of the visitor’s location, the operating system the visitor used when accessing our website, etc. It’s convenient having them accessible, but if these are the types of data you’re after you’re probably better off getting them from Google Analytics.
Usermoves claims to have easy to understand analytics for anyone so give it a try, and you might find out many things you didn’t know before about your website visitors’ behaviors. In fair disclosure, it’s our preferred platform due to its simplicity and value-for-money.

Crazyegg
is a widely-used and effective tool known for heatmaps, but it offers more for your UX and UI too. Crazyegg has “confetti reports” that allow you to see clicks by criteria like time, search terms, sources, and more; they’re an improved version of the typical heatmaps we’ve already mentioned. Just like User moves, Crazyegg also has session recordings as supports split-testing as well. Crazyegg advertises itself as “a pair of x-ray glasses that lets you see exactly what people are doing on your website”. It’s a market leader with a dedicated following and many years of experience to its name. At $24 per month for the most basic offering, it’s still quite affordable.

Clicktale
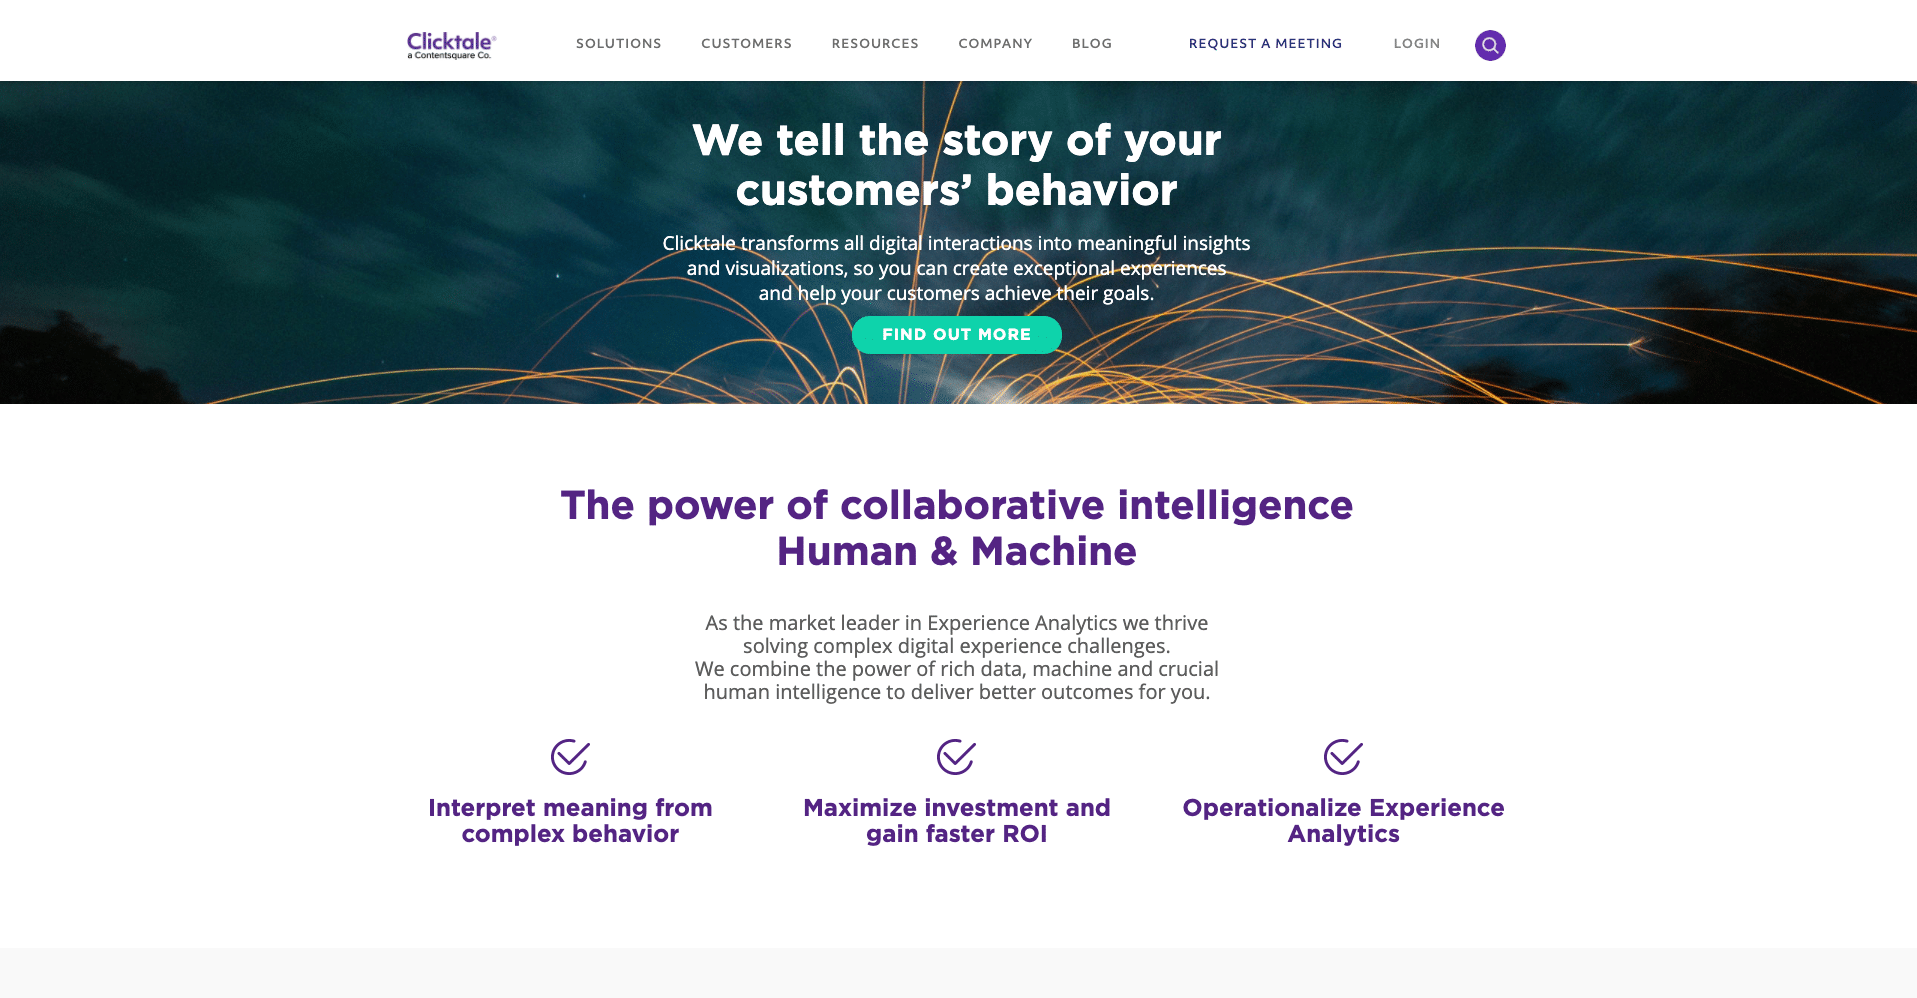
Clicktale presents data in aggregate, which makes it possible to see how visitors interact with your website UX and UI considering the different elements you feature. This functionality is incredibly useful when it comes to assessing your navigation menus, landing pages, and product information pages. Apart from offering accuracy, Clicktale has the ability to make up for responsive design websites and several screen resolutions.
With Clicktale’s capabilities for making various types of comparison, you can choose to get a Before and After heatmaps to showcase your findings; these are easily digestible for people who might not understand technical terms and advanced analytics.
While Crazyegg and Usermoves are geared towards SMEs, Clicktale is more of an enterprise beast.

Insights & value for UX and UI
Tools like session recordings and heatmaps make us feel as if we’re right next to our customers and website visitors as they browse our website in search of information to complete their goals. This perspective opens up a new world of insights for both UX and UI designers and marketers.
The power of these tools for UX and UI especially, is that they provide empirical data that bridges the gap between our assumptions and the realities of our visitors’ expectations and actions.
For larger teams, this data can serve as powerful and persuasive arguments to present when suggesting changes or new initiatives to management and executive teams. Nothing like cold hard data to help take conflicting egos and personal opinions out of the picture…
To help make the most out of these data tools for your UX and UI website features, and ensure they create the most value, we need to prepare. Here’s a shortlist of points to consider:
- Set goals– Any analysis is rarely effective without a specific goal in mind. We should always ask ourselves: Why are we recording these sessions? What specific screens and areas are we looking to assess and improve?
- Prioritize plans– Our ultimate goal might be to make our websites flawless, but that will take a lot of steps to achieve. Having a plan to work from our most pressing concerns is always a good idea. If for example, our homepage bounce rate is too high for comfort, it’s worth starting with attempting to understand why that’s the case, before tackling anything else.
- Use segmentation– A common mistake is using session recording without segmentation. A lack of segmentation will likely result in a lack of insights as there are too many variables at play for us to be able to draw any meaningful conclusions from the data made available.
Possible Misuse of Session Recordings; Heatmaps
While session recordings and heatmaps have a strong appeal due to the data they provide, and the undeniable wow-factor that they bring to any planning session, these tools have their limitations and it’s best to be aware of these as well:
- You don’t need to record every single session always – Session recording and heatmaps are fantastic opportunities and the data they provide are valuable, but there are performance and usage costs to implementing these technologies. Collect enough data to reach actionable conclusions and then be sure to remove the scripts from your site until you’re ready to start another experiment.
- Privacy compliance – As rules and regulations about the use of internet technologies in relation to customer privacy are more widely established worldwide it’s important to understand not only how these restrictions affect session recordings and screen capturing, but also how they’re changing visitor’s expectations regarding the degree to which they’re being monitored. We strongly advocate that you properly inform your visitors about the data you’re recording on your privacy page, with a link from your homepage.
- Technological impact – Use of scripts of the type that enables user session recording can tamper with your user’s experience of your site and can affect the perceived speed with which your site loads. Be sure to test extensively after implementing these tools to ensure the likelihood of adverse impacts is minimized.
- No tool suits every website and platform – We’ve listed a few options above because we’re acutely aware that, as with any tool, selecting a vendor for session recordings is NOT a one-size-fits-all paradigm. Some of them suit certain use cases better than others. Don’t settle with the first tool you come across without educating yourself about alternatives.
- Always look at both qualitative and quantitative data – Sometimes we give too much emphasis to one and too little to the other. Make use of your quantitative analytics from Google Analytics in conjunction with what you see as you watch the session recordings and heatmap. The best improvement action plans are reached through an approach that combines them both
Conclusions
Competition for online attention and customers is the most intense it’s ever been, and the new reality of COVID is making it fiercer every day. Winners in this arena are those who are wise enough to appreciate the aggregation of marginal gains through UX and UI, in creating a competitive advantage for themselves.
Session recordings and heatmaps are precisely the type of opportunity to gain such an advantage, but they’ll provide value only if they’re adopted as part of our standard practice for planning website improvements and site re-launches.
If you’re ready to start making your UX and UI website improvement process truly data-driven but aren’t sure where to begin, reach out to us today We’re always happy to help!


